Brand Equity Polling
Capture more brand sentiment signals with novel polling units.
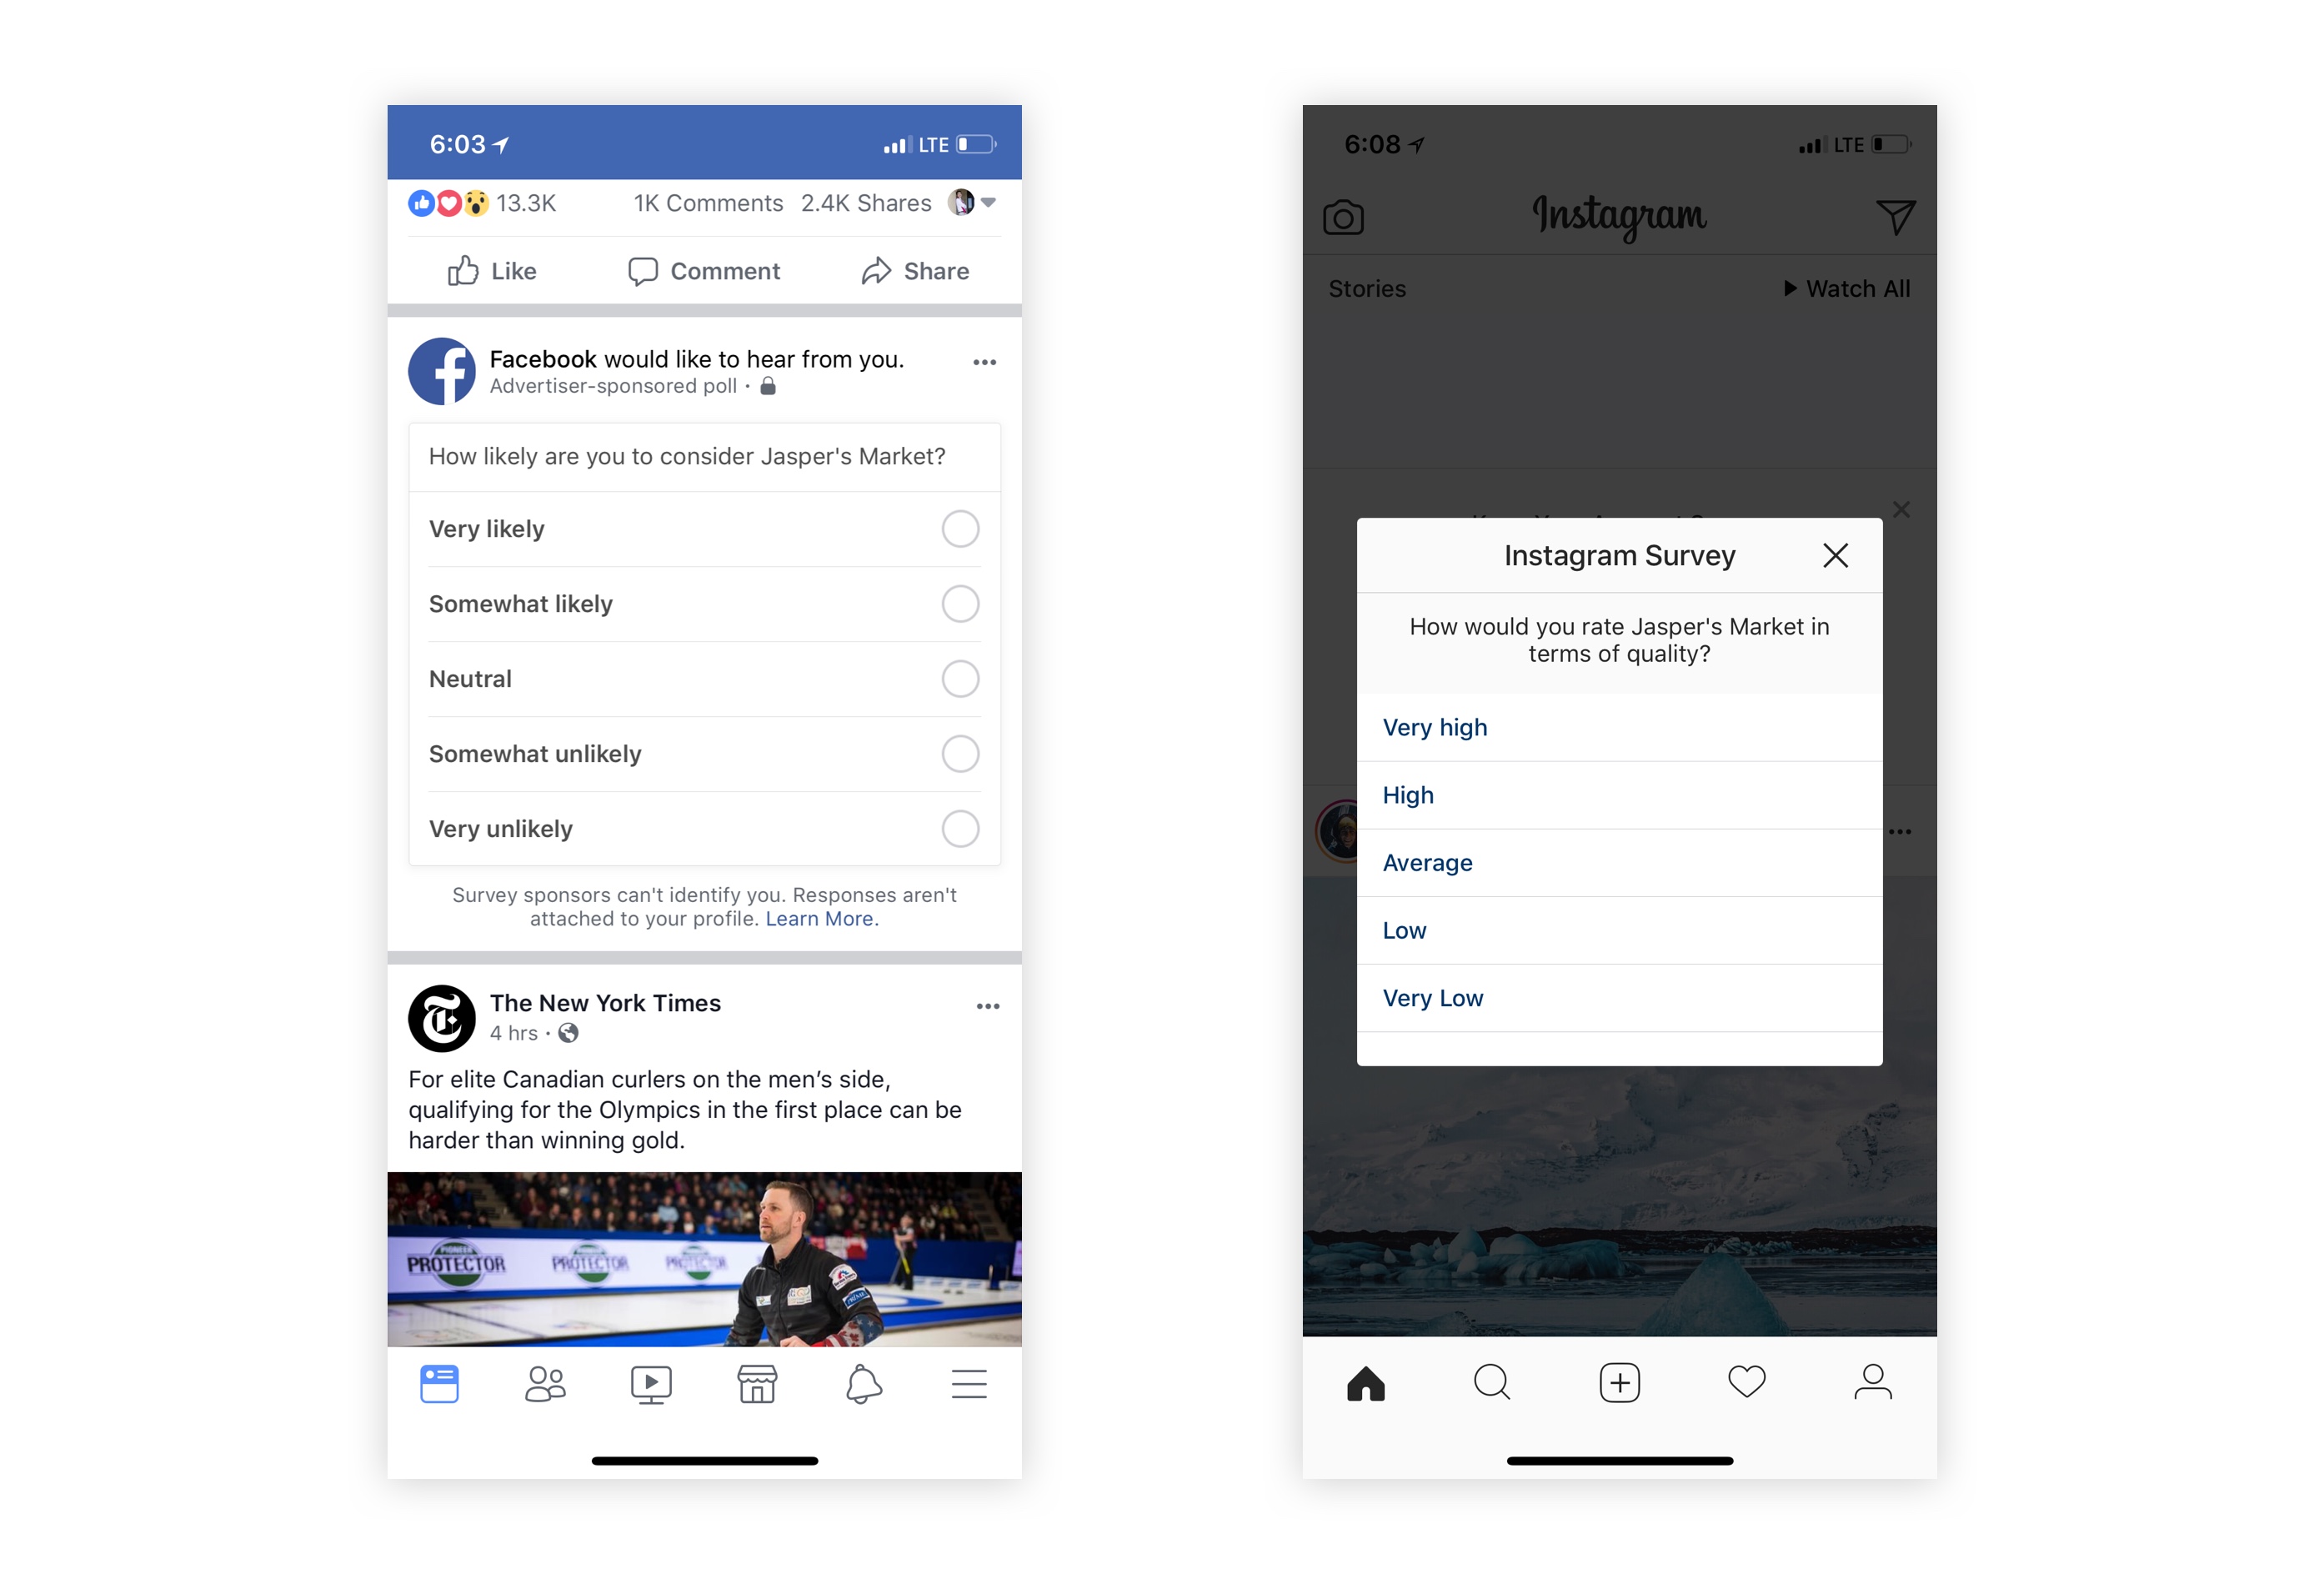
It’s hard for brand advertisers to measure the effectiveness of their brand advertisements on Facebook. The plain polling formats we offered in News Feed were not effective in capturing emotional response or subtle attitude changes.
To solve this, we set out to develop novel brand equity polling formats that are more effective in capturing brand sentiments and tested with our pilot advertisers on their upcoming campaigns. In this prototype, we attempted to measure how connected consumers felt about the Uber brand.
From the data analysis after the campaign, we learned that the new formats agreed with comparable standard formats directionally and appeared to produce greater signal.
Context
I was working on the Lift team within Measurement under the Ads org at Facebook. I was the only designer on this project, collaborating with PM, UX Researcher, Content Strategist, Data Scientist (DS) , Product Marketing Manager (PMM), Illustration Contractor and Mobile Engineers.
What is Brand Lift?
Advertisers use Brand Lift to measure the effectiveness of their brand advertising on Facebook.
We randomize target audience into test and control groups; we only serve ads to the test group; we later serve polls in News Feed asking both groups questions regarding the brand; we then compare the rates of favorable responses between test and control and see if there’s a lift.
Problem
Standard brand polling methods do not have the ability to measure mid-funnel or bottom-funnel brand metrics, such as Message Association, Purchase Intent, in a sensitive way.
This could be that the plain polling format is not effective in capturing emotional response or subtle attitude changes.
Project Goals
- Develop new polling formats that are more effective in capturing emotional response and subtle attitude changes.
- Develop corresponding new equity signal metrics, with which we can package it as a solution to brand advertisers.
- The polling formats should not affect user sentiment/engagement of the core Facebook experience.
Design
Explore
Suggested by our UX Researcher with a PhD in social psychology, we planned to use a common method to measure connection in social science research. In this method, participants are asked to select the visual representation of two circles that most accurately describes the connection they have to a certain concept.
See academic paper: Ingroup Identification as the Inclusion of Ingroup in the Self - Linda R. Tropp, Stephen C. Wright, 2001.
I then explored some UI concepts and used them to help answer some open questions, such as whether we would want to measure connection to competitors as well.
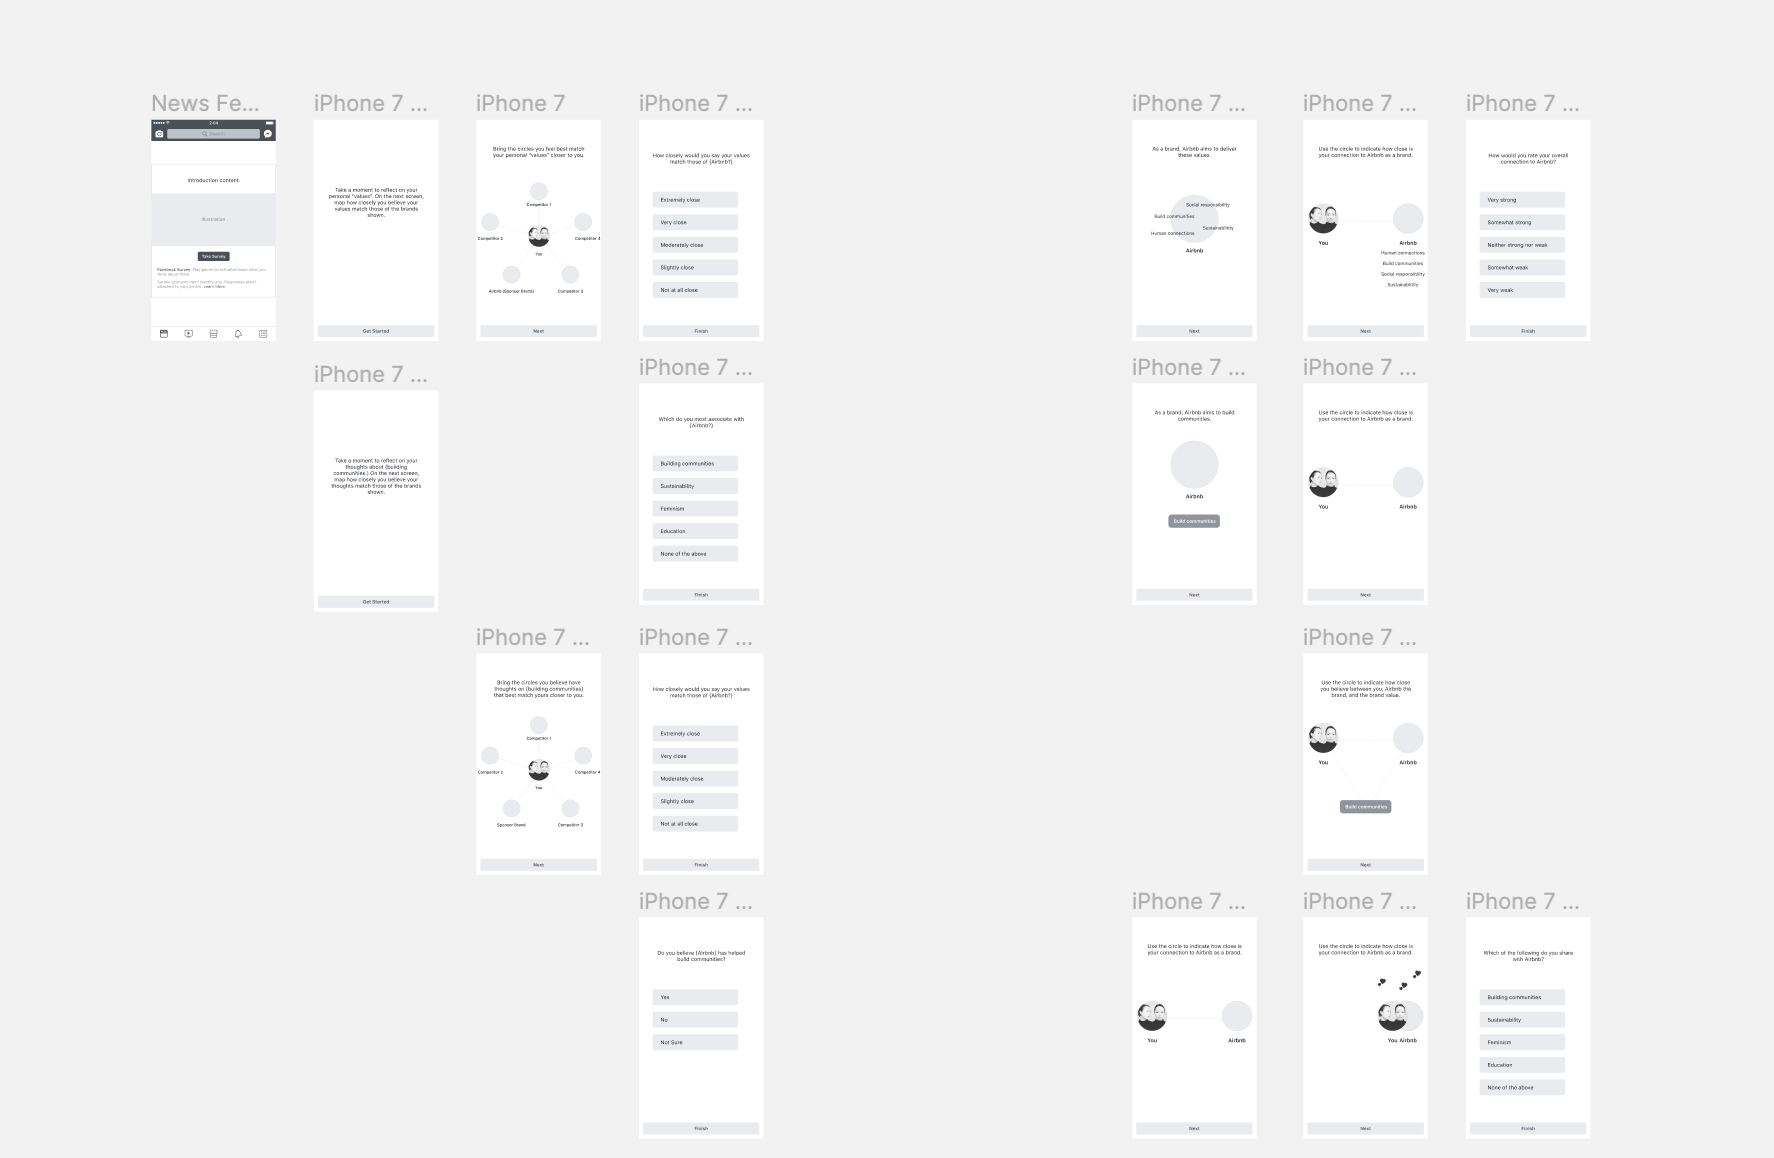
By reviewing these concepts with PMM, DS and UX Researcher, we effectively narrowed our solution to:
- We will focus on the client brand and not measure competitors
- The signal we capture includes connection to both the brand and its values
- We will first let user pick how they want to use two circles to represent connection, then use a multi-choice question to further probe the reasons
- We would not include social factor, as we want measure true value choices, not how people want to appear among friends
- The verticals that work well with this format: Tech, Retail, Luxury, Chain restaurants
Visual & Interaction Given the concept chosen, I started to explore visual and interaction design in more details. Illustrations are placeholders. Content Strategist was also involved to fill in draft content.
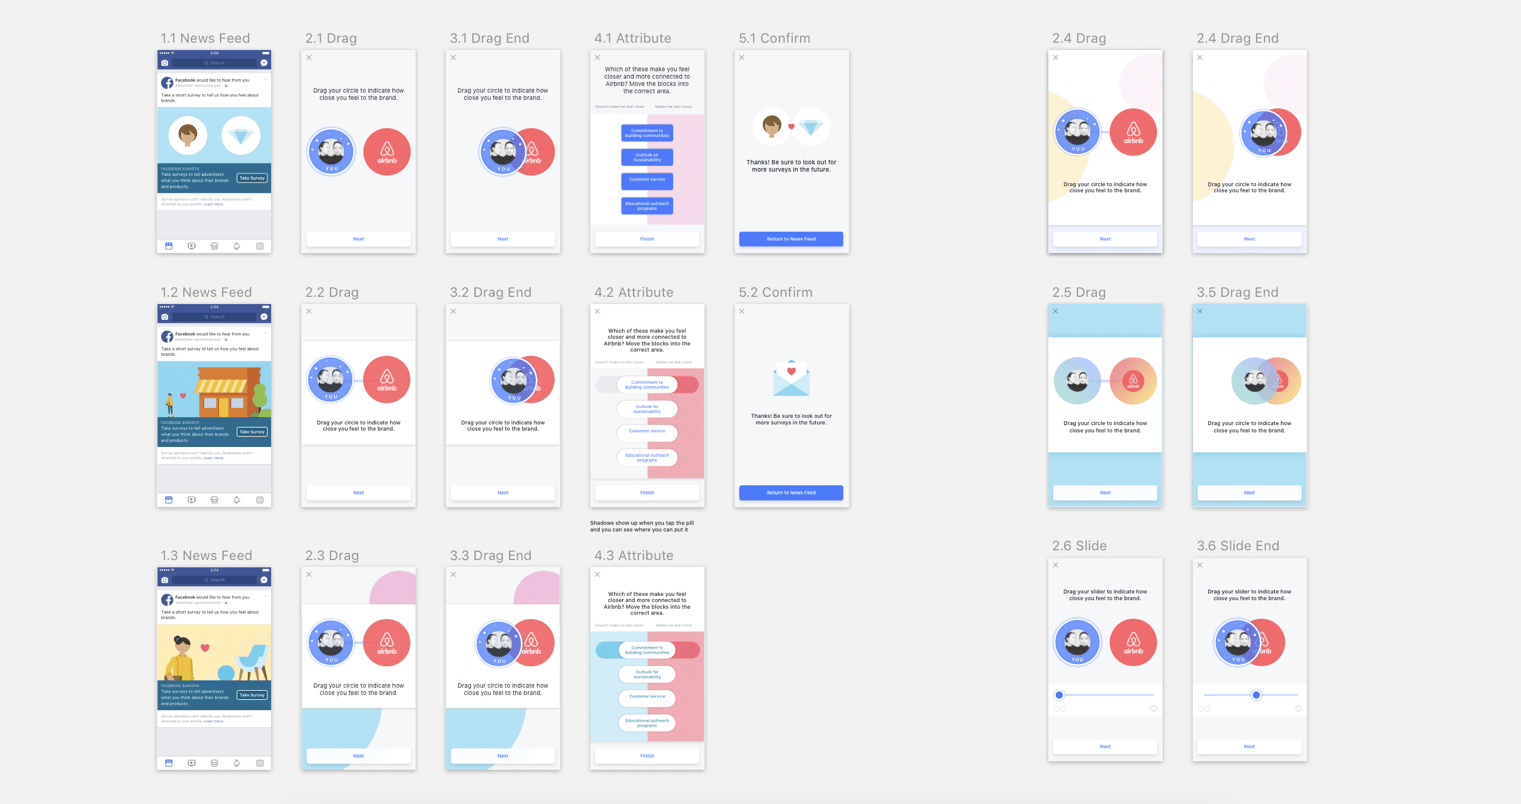
I used Framer to prototype to illustrate the full interaction flow.
Specifically, we need to make a decision between drag vs. slide interaction.
We decided to use the slider because:
- The slider more closely approximates the established metric
- The slider communicates more clearly the affordance and the range of options
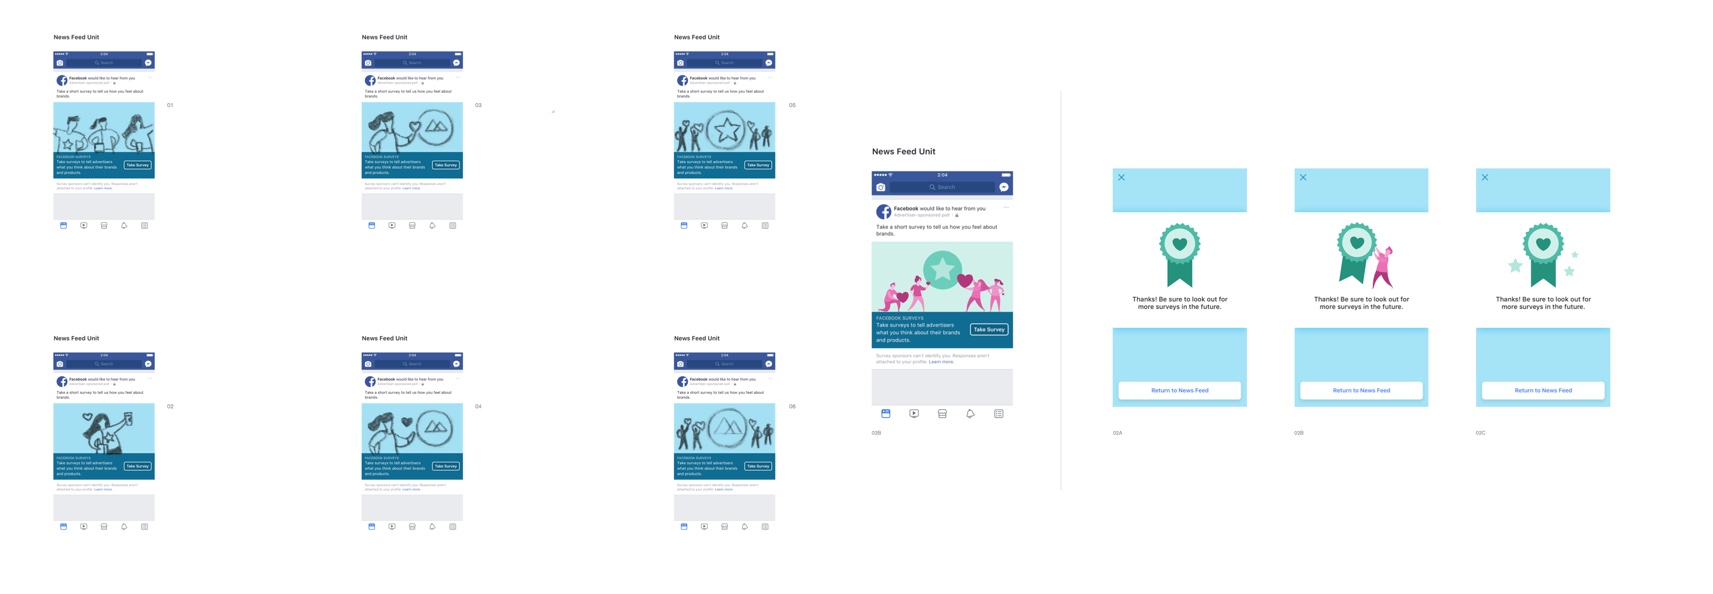
Illustration
I worked with an external illustrator via Email to get the assets ready before the campaign launch. I communicated with him the design brief, asset requirements and he sent me proposals for feedback. We started from rough sketches and through 6 rounds of iterations we settled on the final version.
Launch
I collaborated with PMM and engineers to finalize campaign schedule and ship timeline and made sure design QA would happen before Eng testing.
We successfully launched this poll with Uber's brand campaign in 2017Q4.
Price Premium Format
Following a similar process, we launched another poll format with Mondelez (the parent company of Oreos). This format focuses on measuring Price Premium. The hypothesis is that brand ads can help build and strengthen the brand image, giving advertisers ability to charge a higher price compared to competitors.
Data Analysis
- Both are promising. Both formats agreed with comparable standard formats directionally and appear to produce greater signal.
- Price Premium format measured a -5.9 point stat sig lift while the comparable standard format measured a -1.6 point non-stat sig lift.
- Connection format measured a stat sig 22 pt lift in connection score, while the comparable standard format measured a stat sig 2.8 point lift.
- The CTR from the feed is significantly lower than standard formats. This needs to be fixed before we can be more conclusive with the potential of the new formats.
Learnings
- Have learned to drive project forward with cross-functional partners without much help from PM
- Have learned to involve Eng early and manage the risk of delay
- Have learned to work with remote partners
- Have learned to make design decisions with feedback from diverse perspectives
- Have improved on craft of visual and interaction design