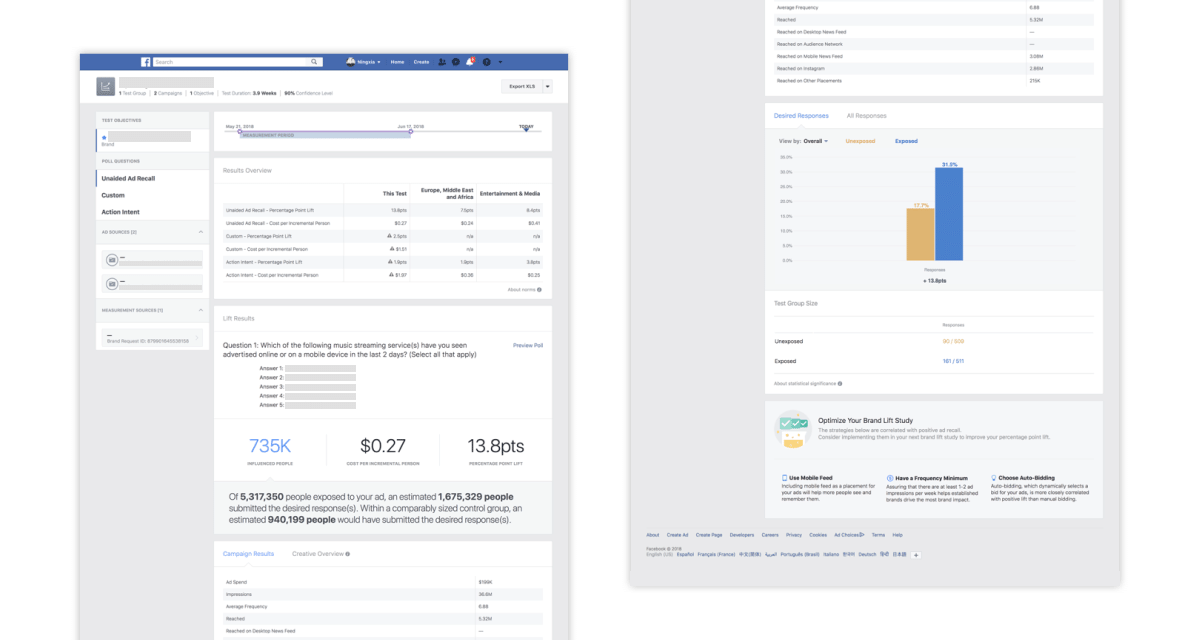
Brand Lift Report
New Brand Lift report that helps advertisers understand and act on test results.
In order to democratize Lift, one of the most scientific measurement tools we offer, we needed to build a consistent, self-serve experience. With the Brand Lift reports we had at the time, it was challenging for advertisers to interpret and act on the test results without the handholding of account teams.
I led the design effort in redesigning the Brand Lift report, working closely with UX Research and Content Strategist to make sure advertisers could accurately understand the results without expert statistics knowledge and know what actions to take.
In parallel, I worked with another designer in developing the lift reporting framework that is extensible and focuses on actionability.
The report was built and shipped together with the self-serve Brand Lift solution. The project had contributed to our top-line metric: measured spend (I did not get to see the detailed analysis).
Context
I was working on the Lift team within Measurement under the Ads org at Facebook. I was responsible of launching this project, collaborating with PM, UX Researcher, Content Strategist, Data Scientist (DS) , Product Marketing Manager (PMM) and Engineers.
What is Brand Lift?
Brand Lift is one of the measurement solutions we offer.
We randomize target audience into test and control groups; we only serve ads to the test group; we later serve polls in News Feed asking both groups questions regarding the brand; we then compare the rates of favorable responses between test and control and see if there’s a lift.
Problem
Lift is the most scientific way we offer to measure effectiveness of advertising on Facebook. At the time, only advertisers with a certain level of budget could have account teams to help setup the test and interpret the results.
In order to empower more advertisers with Lift to make better business decisions and better grow their businesses, we needed to build a more consistent, self-serve experience.
We’ve already learned from prior research that the existing brand lift reports were difficult to understand and act on, due to problems including lack of metric clarity, clear narrative and actionability.
Project Goals
- A new reporting experience that guides advertisers to interpret the results correctly and make more informed business decisions.
- A new reporting framework that not only unifies Brand Lift and Conversion Lift, but also can be extended to support Split Testing, Offline Sales and other measurement tools.
Design
Process
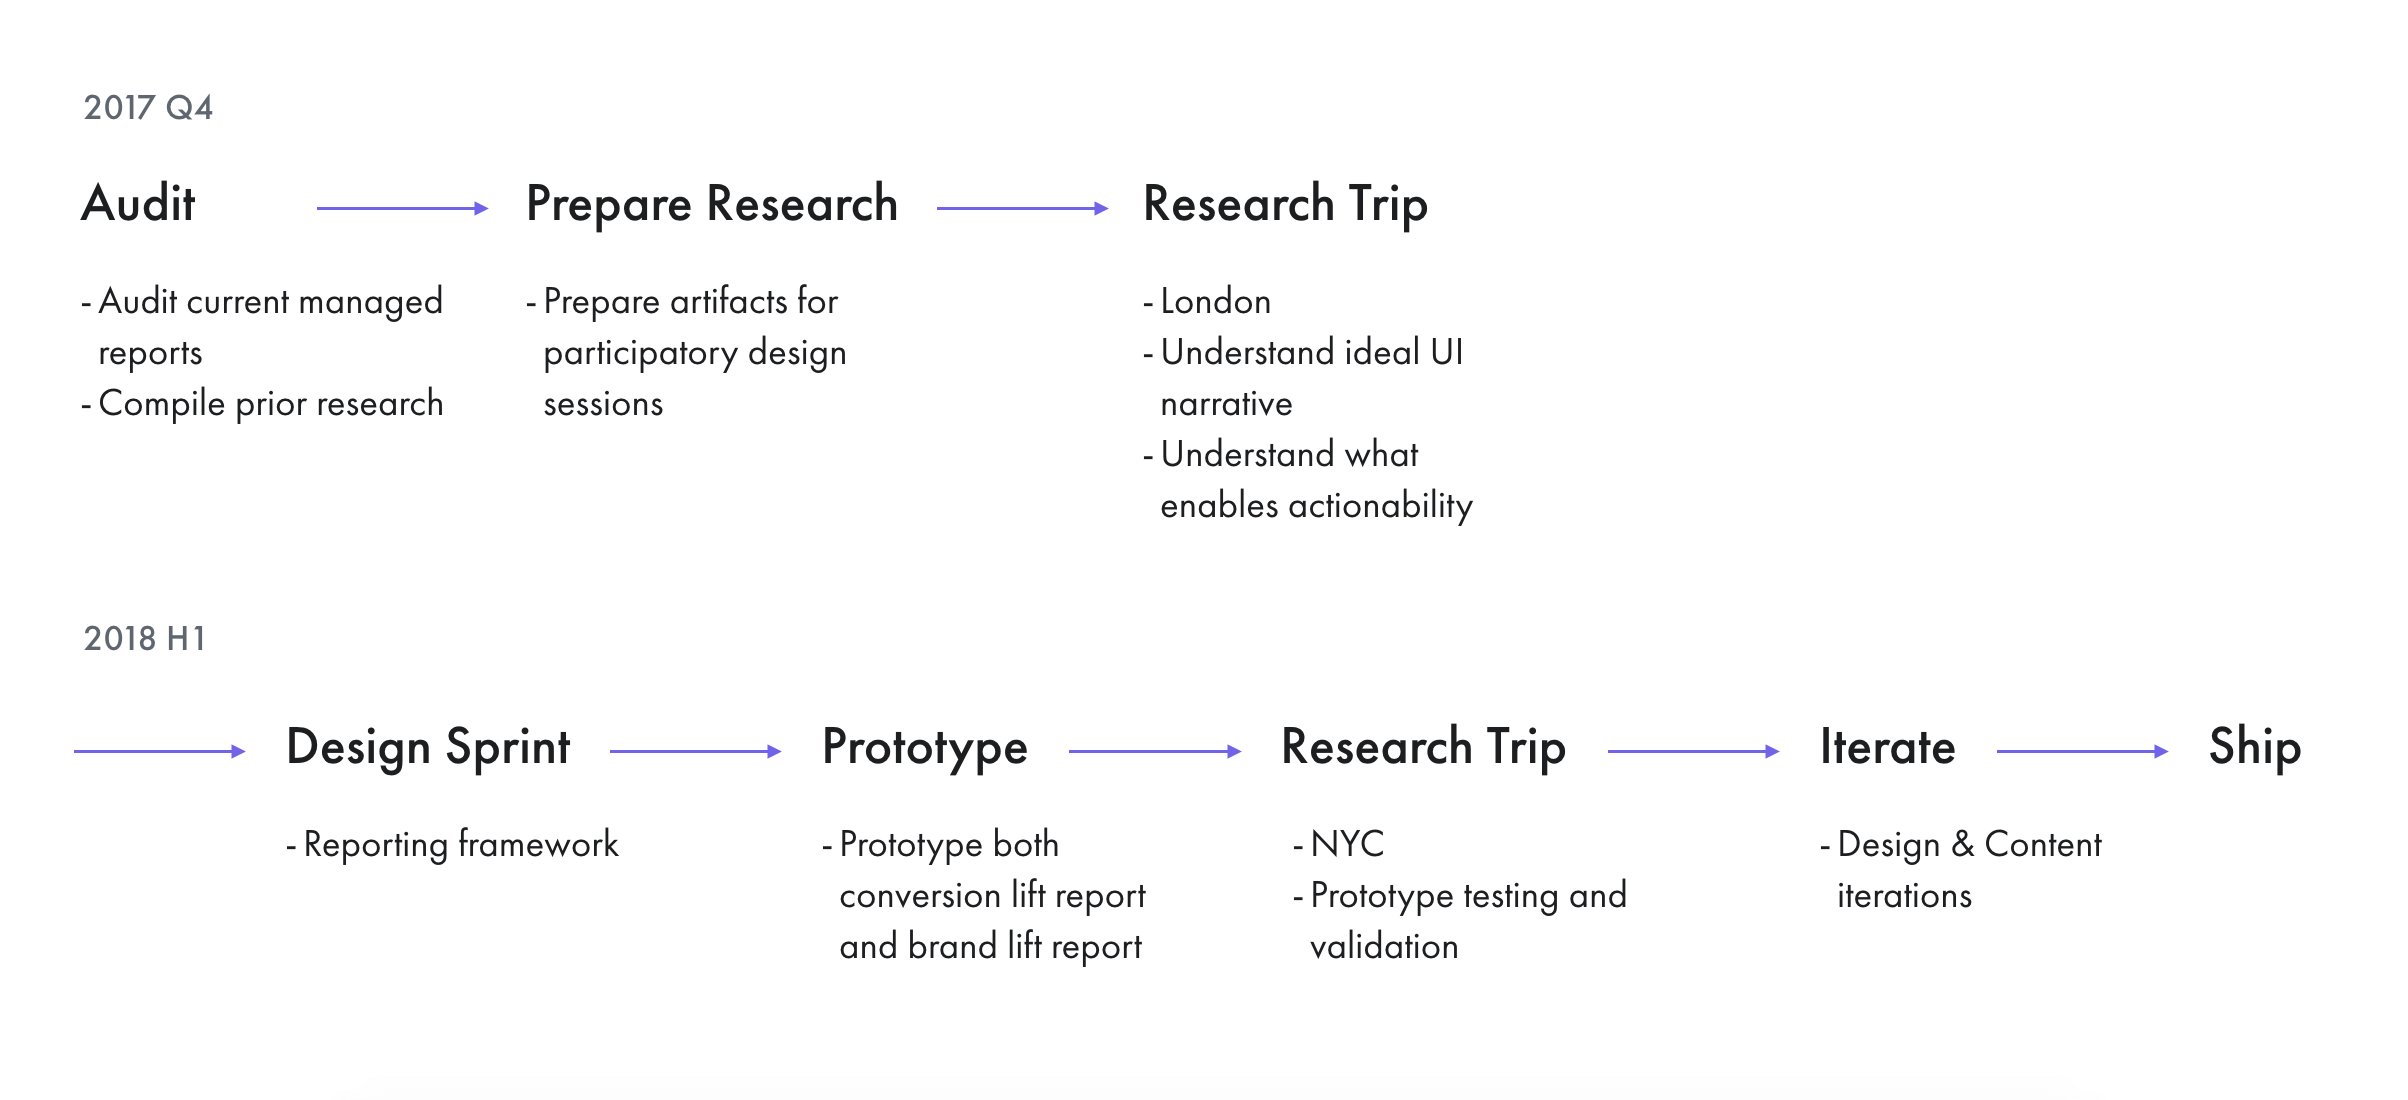
Audit
I started with auditing the existing report UI, where I compiled existing research findings, PMM inbound feedback and evaluated the UI with design principles.
Here are some of the problems synthesized from the audit:
- Lack of a true ”Summary" page made navigating between insights initially confusing.
- Content competes for attention. The report does not offer users a clear way to progress from high-level understanding to deeper-level mastery.
- Advertisers struggle to make sense of some of the metrics, understand how they’re calculated, which negatively impacts trust.
- Advertisers felt that the report was primarily meant for people with a measurement background and it’s challenging for them to make decisions or conclusions without expert help.
- Natural language statements are misleading as they conflate concepts.
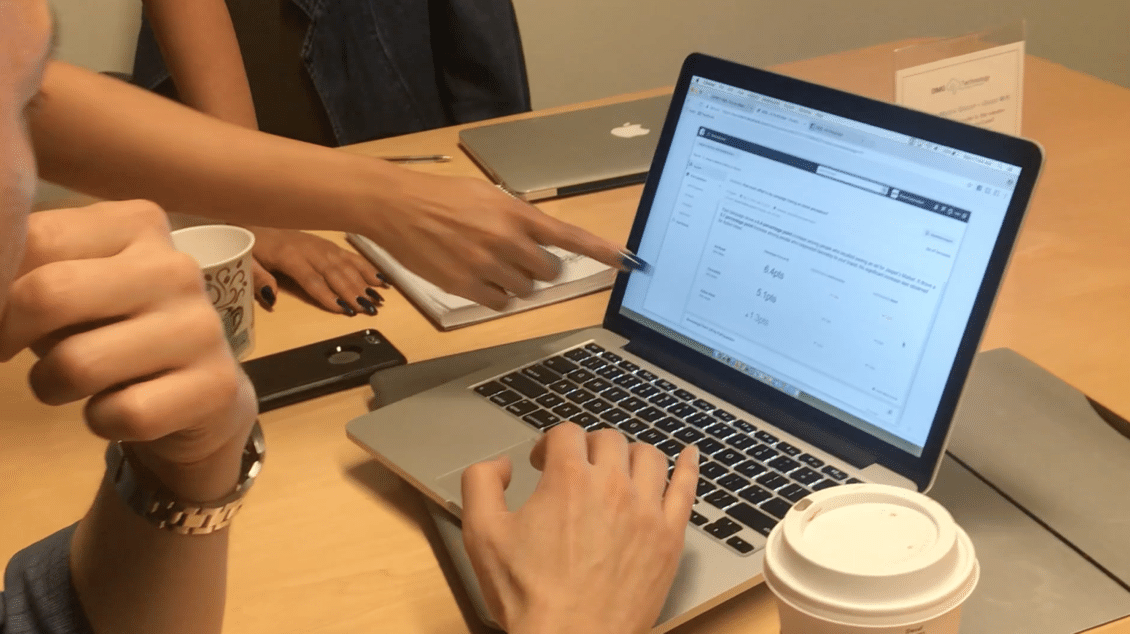
Participatory Design
To further answer the questions of what report narrative makes sense and what helps ease understanding and promotes actionability, we conducted research with 10 advertisers / advertising agencies in London using the participatory design method.
In the research session, participants were given cards each with a description of information and a visual example. They were asked to pick or discard cards based on whether they found the information and how it’s presented helpful. Eventually they were asked to arrange the chosen cards to assemble their ideal report. During the whole session, they were encouraged to talk loud of their rationale.
I led the design of the cards and worked closely with UX Research on planning and conducting the research.
Here’s what we've learned:
- The ideal UI narrative:
- Recap of the test setup
- Results
- Recommendations
- Advertisers desire more actionable data cuts across the report relevant to their business goals
- The ideal report should include more visual, collapsible and downloadable content for internal share-outs
Design Sprint
In parallel, my peer designer was working on the Conversion Lift report, which would be unified on the same platform as another solution we provide. We needed to make sure that we shared the same reporting framework so that the experience would be consistent and transferrable.
We conducted a design sprint with cross-functional partners to work out the framework and tested it by building out prototypes for our respective use cases.

Prototype Testing
Working with UX Research, we tested the prototype with 16 advertisers / advertising agencies across New York City and Chicago to evaluate whether the prototype accomplished the goals.
Here’s what we've learned:
- Need Answer Page to contain all of the data necessary in determining the overall success of the campaign
- Need the reports to communicate terms and concepts in their language
- Need plain language explanation of metrics and corresponding calculations
- Need help establishing basic stat knowledge needed to digest reports
- Need Facebook to take a clear stance on measurement definitions
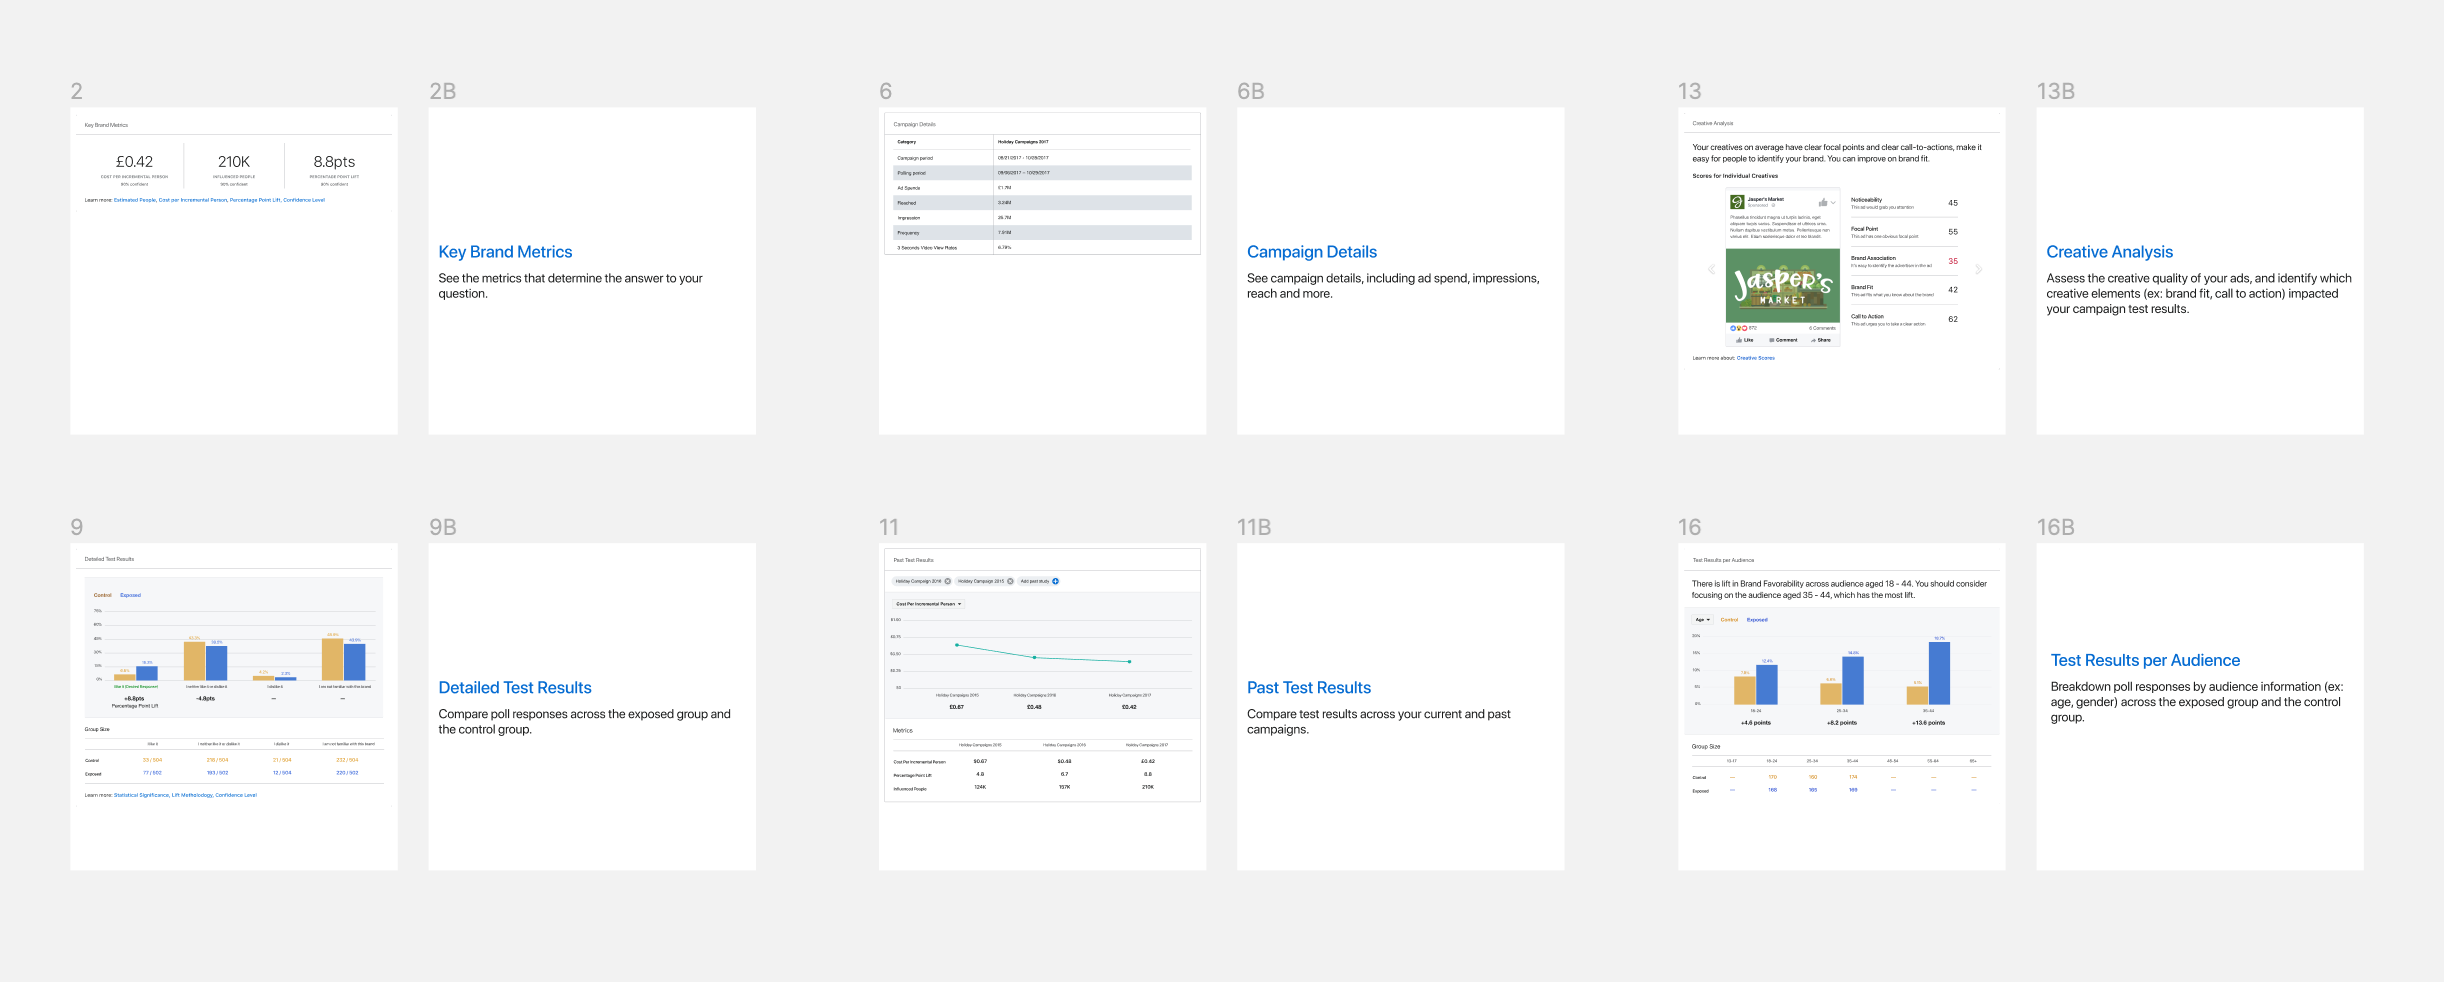
Iterate & Ship
A lot of the problems uncovered in the research were about content. I worked in close loop with Content Strategist to revise content, including metric definitions, metric explanations, natural language statements and test terminology. There was a lot of complexity in explaining the confidence level and how we advise advertisers in different cases, e.g. low confidence, high confidence etc.
After content was finalized, I spec’ed out the design, worked with engineers on clarifying requirements, covering edge cases etc.
Here are the design specs for localization.
The project was launched together with the self-serve Brand Lift solution. It had contributed to our top-line metric: measured spend, but I did not get to see the detailed analysis.
Learnings
- Content and design need work together to tell a cohesive story
- It’s challenging to communicate complex concepts in simple terms while eliminating possibilities of misunderstandings
- Have learned different research methodologies and how to work with UX Research